from mpl_toolkits import mplot3d
import numpy as np
import matplotlib.pyplot as plt
from matplotlib import cm
import matplotlib.pylab as pylab
params = {'axes.labelsize': '20', 'font.weight' : 10}
plt.rcParams.update(params)
plt.rcParams["font.family"] = "normal" #Times New Roman"
fig = plt.figure()
ax1 = plt.axes(projection='3d')
ax1.set_xlabel('gauge invariant')
ax1.set_ylabel(r'$pure ~gauge$',  fontweight=900)
ax1.set_zlabel('density', fontweight=500)
ax1.xaxis.set_ticklabels([])
ax1.yaxis.set_ticklabels([])
ax1.zaxis.set_ticklabels([])
for line in ax1.xaxis.get_ticklines():
    line.set_visible(False)
for line in ax1.yaxis.get_ticklines():
    line.set_visible(False)
for line in ax1.zaxis.get_ticklines():
    line.set_visible(False)

ax1.w_xaxis.pane.fill = False
ax1.w_yaxis.pane.fill = False
ax1.w_zaxis.pane.fill = False
ax1.w_xaxis.set_pane_color((0.0, 0.0, 0.0, 0.0))
ax1.w_yaxis.set_pane_color((0.0, 0.0, 0.0, 0.0))
ax1.w_zaxis.set_pane_color((0.0, 0.0, 0.0, 0.0))
/Users/cranmer/anaconda3/envs/jax-md/lib/python3.6/site-packages/matplotlib/font_manager.py:1241: UserWarning: findfont: Font family ['normal'] not found. Falling back to DejaVu Sans.
  (prop.get_family(), self.defaultFamily[fontext]))
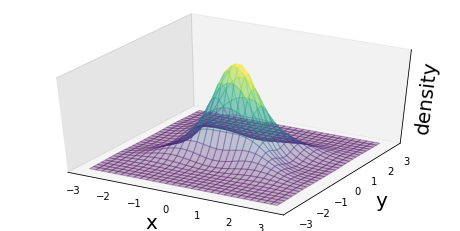
def f(x, y):
    return  (np.exp(-(x-y)**2) + np.exp(-(x+y)**2))


def g(x, y):
    return np.exp(-y**2) * (np.exp(-(x-y)**2) + np.exp(-(x+y)**2))

def norm(y):
  return 1./np.exp(-y**2)


x = np.linspace(-3, 3, 30)
y = np.linspace(-3, 3, 30)

X, Y = np.meshgrid(x, y)
Z1 = f(X, Y)
Z2 = g(X, Y)
fig = plt.figure()
fig = plt.figure(figsize=plt.figaspect(.5))

ax1 = plt.axes(projection='3d')

norm = plt.Normalize(Z2.min(), Z2.max())
colors = cm.viridis(norm(Z2))
rcount, ccount, _ = colors.shape


#ax.contour3D(X, Y, Z, 30, cmap='binary')
rcount=1
ax1.plot_surface(X, Y, Z2, rcount=ccount, facecolors=colors, ccount=ccount, shade=False, alpha=.3)
#ax1.plot_wireframe(X, Y, Z2, rstride=150, cstride=100, color='grey',lw=1)
ax1.set_xlabel('x')
ax1.set_ylabel('y')
ax1.set_zlabel('density')
#ax1.xaxis.set_ticklabels([])
#ax1.yaxis.set_ticklabels([])
#ax1.xaxis.set_ticklabels([])
#ax1.yaxis.set_ticklabels([])
ax1.zaxis.set_ticklabels([])
for line in ax1.xaxis.get_ticklines():
    line.set_visible(False)
for line in ax1.yaxis.get_ticklines():
    line.set_visible(False)
for line in ax1.zaxis.get_ticklines():
    line.set_visible(False)

#ax1.w_xaxis.pane.fill = False
#ax1.w_yaxis.pane.fill = False
#ax1.w_zaxis.pane.fill = False
ax1.w_xaxis.set_pane_color((0.0, 0.0, 0.0, 0.10))
ax1.w_yaxis.set_pane_color((0.0, 0.0, 0.0, .05))
#ax1.w_zaxis.set_pane_color((0.0, 0.0, 0.0, 0.0))
#ax1.zaxis._axinfo['label']['space_factor'] = .1
ax1.zaxis.labelpad=-10
ax1.xaxis.labelpad=10
ax1.yaxis.labelpad=10


#ax1.grid(b=None)
#plt.axis('off')
ax1.grid(False)
ax1.view_init(40, -60)
plt.savefig('./assets/schematic_p_xy.png')
<Figure size 432x288 with 0 Axes>
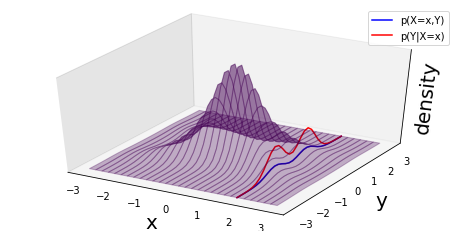
xline = 1.75+0.*x
yline = 1*y
zline = g(xline,yline)
fig = plt.figure()
fig = plt.figure(figsize=plt.figaspect(.5))

ax1 = plt.axes(projection='3d')

norm = plt.Normalize(Z2.min(), Z2.max())
colors = cm.viridis(norm(Z2))
rcount, ccount, _ = colors.shape


#ax.contour3D(X, Y, Z, 30, cmap='binary')
rcount=1
ax1.plot_surface(X, Y, Z2, rcount=rcount, facecolors=colors, ccount=ccount, shade=False, alpha=.3)#, label='p(X,Y)')
ax1.plot3D(xline, yline, zline, 'blue', label='p(X=x,Y)')
ax1.plot3D(xline, yline, 3*zline, 'red',label='p(Y|X=x)')
#ax1.plot_wireframe(X, Y, Z2, rstride=150, cstride=100, color='grey',lw=1)
ax1.set_xlabel('x')
ax1.set_ylabel('y')
ax1.set_zlabel('density')
#ax1.xaxis.set_ticklabels([])
#ax1.yaxis.set_ticklabels([])
ax1.zaxis.set_ticklabels([])
for line in ax1.xaxis.get_ticklines():
    line.set_visible(False)
for line in ax1.yaxis.get_ticklines():
    line.set_visible(False)
for line in ax1.zaxis.get_ticklines():
    line.set_visible(False)

#ax1.w_xaxis.pane.fill = False
#ax1.w_yaxis.pane.fill = False
#ax1.w_zaxis.pane.fill = False
ax1.w_xaxis.set_pane_color((0.0, 0.0, 0.0, 0.10))
ax1.w_yaxis.set_pane_color((0.0, 0.0, 0.0, .05))
#ax1.w_zaxis.set_pane_color((0.0, 0.0, 0.0, 0.0))
#ax1.zaxis._axinfo['label']['space_factor'] = .1
ax1.zaxis.labelpad=-10
ax1.xaxis.labelpad=10
ax1.yaxis.labelpad=10


#ax1.grid(b=None)
#plt.axis('off')
ax1.grid(False)
ax1.view_init(40, -60)
plt.legend()
plt.savefig('./assets/schematic_p_y_given_x.png')
<Figure size 432x288 with 0 Axes>
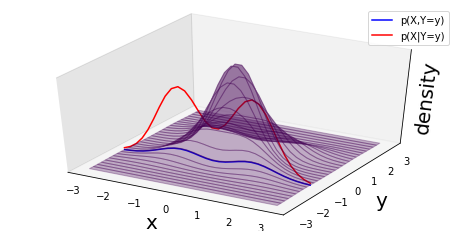
xline = 1.*x
yline = -1.15+0*y
zline = g(xline,yline)
fig = plt.figure()
fig = plt.figure(figsize=plt.figaspect(.5))

ax1 = plt.axes(projection='3d')

norm = plt.Normalize(Z2.min(), Z2.max())
colors = cm.viridis(norm(Z2))
rcount, ccount, _ = colors.shape


#ax.contour3D(X, Y, Z, 30, cmap='binary')
rcount=1
ax1.plot_surface(X, Y, Z2, rcount=ccount, facecolors=colors, ccount=rcount, shade=False, alpha=.3)#, label='p(X,Y)')
ax1.plot3D(xline, yline, zline, 'blue', label='p(X,Y=y)')
ax1.plot3D(xline, yline, 6*zline, 'red',label='p(X|Y=y)')
#ax1.plot_wireframe(X, Y, Z2, rstride=150, cstride=100, color='grey',lw=1)
ax1.set_xlabel('x')
ax1.set_ylabel('y')
ax1.set_zlabel('density')
#ax1.xaxis.set_ticklabels([])
#ax1.yaxis.set_ticklabels([])
ax1.zaxis.set_ticklabels([])
for line in ax1.xaxis.get_ticklines():
    line.set_visible(False)
for line in ax1.yaxis.get_ticklines():
    line.set_visible(False)
for line in ax1.zaxis.get_ticklines():
    line.set_visible(False)

#ax1.w_xaxis.pane.fill = False
#ax1.w_yaxis.pane.fill = False
#ax1.w_zaxis.pane.fill = False
ax1.w_xaxis.set_pane_color((0.0, 0.0, 0.0, 0.10))
ax1.w_yaxis.set_pane_color((0.0, 0.0, 0.0, .05))
#ax1.w_zaxis.set_pane_color((0.0, 0.0, 0.0, 0.0))
#ax1.zaxis._axinfo['label']['space_factor'] = .1
ax1.zaxis.labelpad=-10
ax1.xaxis.labelpad=10
ax1.yaxis.labelpad=10


#ax1.grid(b=None)
#plt.axis('off')
ax1.grid(False)
ax1.view_init(40, -60)
plt.legend()
plt.savefig('./assets/schematic_p_x_given_y.png')
<Figure size 432x288 with 0 Axes>