Accept / Reject Monte Carlo
import numpy as np
import matplotlib.pyplot as plt
#this is an example distribution, feel free to change it
def p(x):
    return np.sin(x-0.5)**2 * np.exp(-x**2) + .2*np.exp(-x**2) #note, this one is not normalized pdf
#let's plot it
x = np.linspace(-3,3,100)
y = p(x)
plt.plot(x,y)
def accept_reject(N):
    xmin = -3
    xmax = 3
    pmax = 0.8

    n_accept=0
    x_list = []
    while n_accept < N:
        t = (xmax-xmin)*np.random.rand() + xmin
        y = np.random.rand()
        if y < p(t)/ pmax:
            n_accept += 1
            x_list.append(t)
    return x_list
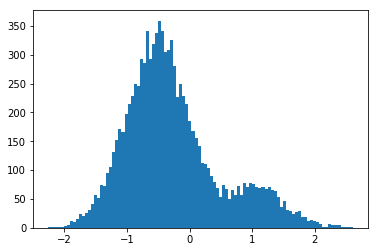
x = accept_reject(10000)
bins, edges, patches = plt.hist(x, bins=100)
xmin = -3
xmax = 3
pmax = 0.8
N_MC = 100000

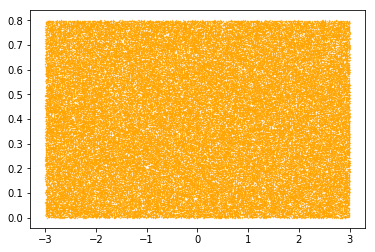
t = np.random.uniform(xmin,xmax,N_MC)  #get uniform temporary x values
y = np.random.uniform(0,pmax,N_MC)  # get uniform random y values
# plot all the t-y pairs
plt.scatter(t,y, s=0.1, c='orange')
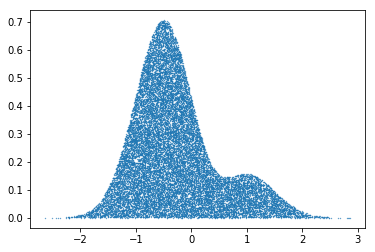
#make a mask that keeps index to the accepted pairs. Plot them
mask = y<p(t)
plt.scatter(t[mask],y[mask], s=0.1)
#inspect the mask
mask
#inspect the 0th entry
t[0], y[0], p(t[0]), mask[0]
#How many t's are there beore / after the mask
t.size, t[mask].size
accept_prob = t[mask].size/t.size
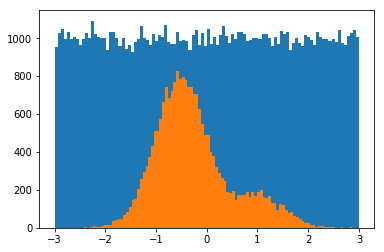
#histogram the t values with and without the mask
_ = plt.hist(t, bins=100)
_ = plt.hist(t[mask], bins=100)
%%timeit
xmin = -3
xmax = 3
pmax = 0.8
N_MC = 100000

t = np.random.uniform(xmin,xmax,N_MC)  #get uniform temporary x values
y = np.random.uniform(0,pmax,N_MC)  # get uniform random y values
mask = y<p(t)
%%timeit
N_MC = 100000
#for a fair comparison, we will ask accept_reject to return the same number
average_accept = N_MC*accept_prob
x = accept_reject(average_accept)
#How much faster?
564/5.56


